
Funnel Analytics
Overview
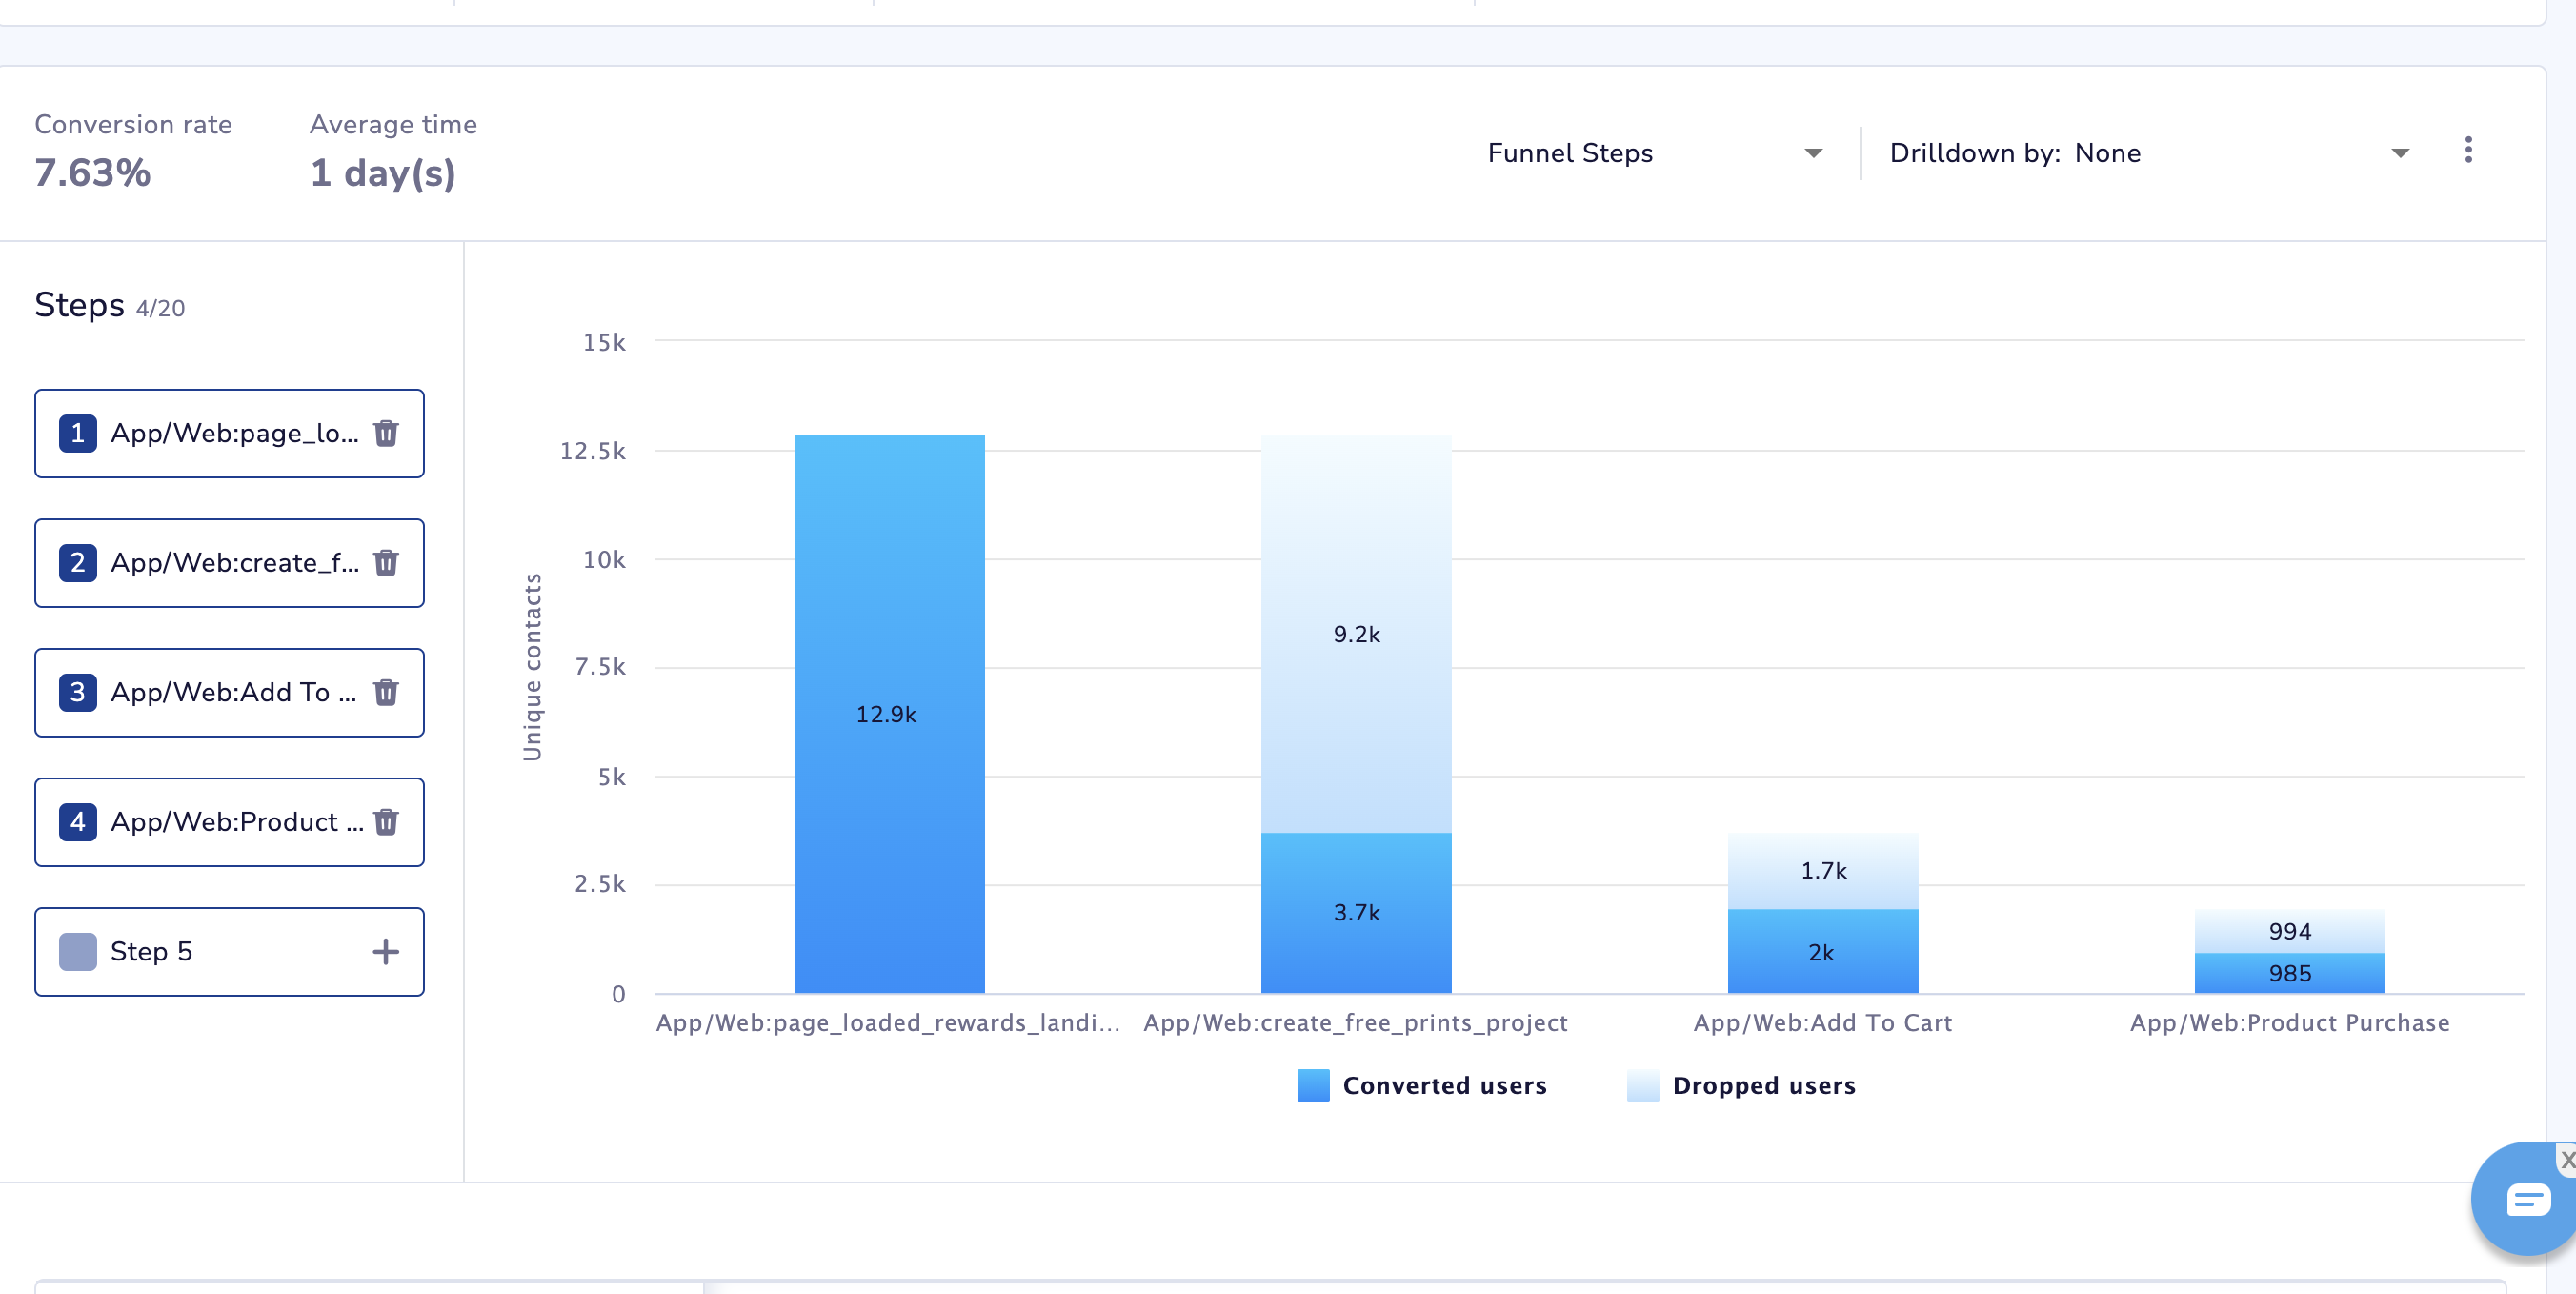
Funnel Analytics enables you to calculate conversion rates on specific Contacts’ behaviours. A funnel is a set of steps that the Contacts go through before they can reach the final marketing goal, like making a purchase, signing up, making a reservation, etc. Funnel Analytics enables you to know how many contacts enter each step of the funnel, how many drop out at each step, and how many finally reach the bottom of the funnel which is your marketing goal. This data can help in identifying the gaps and taking necessary measures to fill them up.
In CEE, you can design your cross-channel funnels the way you need. You can identify specific points in the customer journey where your efforts are not bringing the desired result, thus empowering you with valuable information to modify your marketing.
Elements of a Funnel
Following elements shall help you understand how to create a funnel
Contacts
In order to analyse a funnel, you can select all contact, a particular list or segment.
Duration
The number of days for which the funnel is to be analysed. Only those users will be considered who perform the first step of the funnel. Example, 7 days funnel
Funnel Conversion Time
It is time defined by the user to complete all the steps of the funnel. It can defined in hours, days, months & weeks.
Example FCT = 5 days & duration = 7 days (1st-7th). In such case users who perform step 1 of the funnel on 1st need to complete the funnel by 5th and users who perform step 2 of the funnel on 7th need to complete the funnel steps by 12th.
Funnel Step Definition
Click on the '+' button to define the funnel steps.
Select Channel
Select Channel metric to be analysed.
Select Broadcast, Trigger, Tags.
Click Save.
This will plot the unique users who performed the defined step.
Similarly, further steps can be defined. For example, when step 2 is defined and plotted, the output of step 2 will be the unique users who performed step 1 & step 2.
Conversion Rate
Relative to Step 1:
Conversion percentage of contacts from the first step to the respective step.
Hence, the conversion rate for last step relative to step 1 will be same as that for the entire funnel.
Average time is the time taken by the contacts to complete the steps. So, the average time for last step will be same as that for the entire funnel.
Between the Steps:
Conversion percentage of contacts between 2 steps.
Average time is the time taken by the contacts to complete the two consecutive steps.


Various attributes like age, city, gender can also be compared across the funnel.
Trend Chart
You can see the trend between 2 steps by clicking the ( ->) right arrow. It shows the dropped contacts as well as the converted contacts, and it can be saved as a segment to later consumption.

FAQs
- What is the max number of filters/drill-downs allowed in your funnels?
Applying filters is possible for App/web activity steps, maximum 5 filters for each step can be applied. Users can breakdown their funnel basis 3 attributes - Age, Gender & City. The breakdown can we downloaded as a CSV.
- What's the max time range that can be applied on a funnel (Does the custom date range have any limitations?)
A funnel will plot data for upto 6 months of a selected date range- You have a sharing link for the funnel created. Does the user have the ability to modify a 'shared' funnel?
We don't have sharing link. It is planned as part of the roadmap of revamping funnel analytics. You can download the funnel as a .png image- Can we set goals on funnel performance and track against those goals?
Not currently.
Updated 4 months ago